How to debug a PowerApp?, Debugging in PowerApps is the process of identifying and resolving errors or problems in your app. In this blog post we will learn some tips to find the errors and solve in PowerApps ,How to use PowerApps monitor tool and how to use the step by step debugger in PowerApps.
How to debug a PowerApp?
We always ask ourselves while using PowerApps, Can we debug in PowerApps!!!. Yes we can use the debugger to find and fix errors in your app.
Here are some tips on how to debug PowerApps
Review error messages
When an error occurs in your app, PowerApps will usually display an error message. Review the error message and try to determine the cause of the issue you have to make Sure that the Formula-level error management feature is enabled to help you check your formula in the PowerApps designer
- Open the app that you want to debug in the PowerApps Studio.
- Click on the “Settings” gear at the top of the screen.
- Make Sure that the toggle is on for the “Formula-level error management” option.
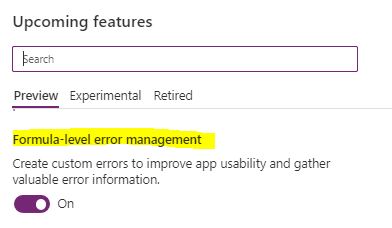
This will help you to trace your formula and checking code/query result direct in the power app designer

Debug Power Apps using Monitor tool
One of the most critical components of any business application is monitoring its performance and usage. The Monitor tool in PowerApps is a feature that allows you to troubleshoot and monitor the performance of your PowerApps applications. It allows app makers to view a stream of events from a user’s session in order to diagnose and troubleshoot issues. in Canvas app you can use Monitor to view events while building a new app in Power Apps Studio or to monitor published apps in real time. In Model-driven app you can track page navigation, command executions, and so on.
So the Monitor tool in PowerApps is an excellent way to track the health of your application and identify issues before they become critical problems.
Monitor PowerApps
- The Monitor tool shows any errors that have occurred in your application. It provides detailed information on the error type, the time it occurred, and the stack trace, these things can help you quickly identify and resolve errors in your application.
- Monitor Power Apps enable you to find how quickly your application is loading and responding to user requests. You can track the average load time, the time to first byte, and the server response time. By monitoring these metrics, you can identify performance issues and optimize your application’s performance.
- The Monitor tool allows you to filter the data by date, user, or session.
- Monitor tool provides detailed information on the requests made to your application
Use Monitor tool in PowerApps
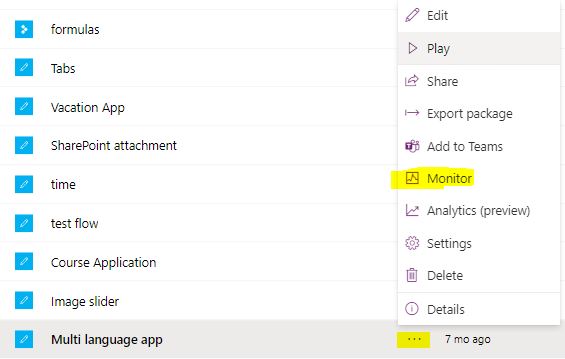
- you can access the monitor tool from the app’s details page in the PowerApps Studio. Once there, click on the Monitor tab, and you will see a dashboard with four sections: Usage, Performance, Errors, and Diagnostics. Then click Select Play published app.
- Or you can access it from your app designer in the left side you from the Advanced tool menu you can select Open Monitor
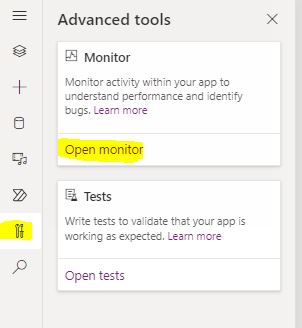
This will open the Monitor tool page,

In this page “Dashboard” you will find any errors that have occurred in your application. If you are experiencing any issues, start by clicking the error to view more details, including the error message and stack trace.
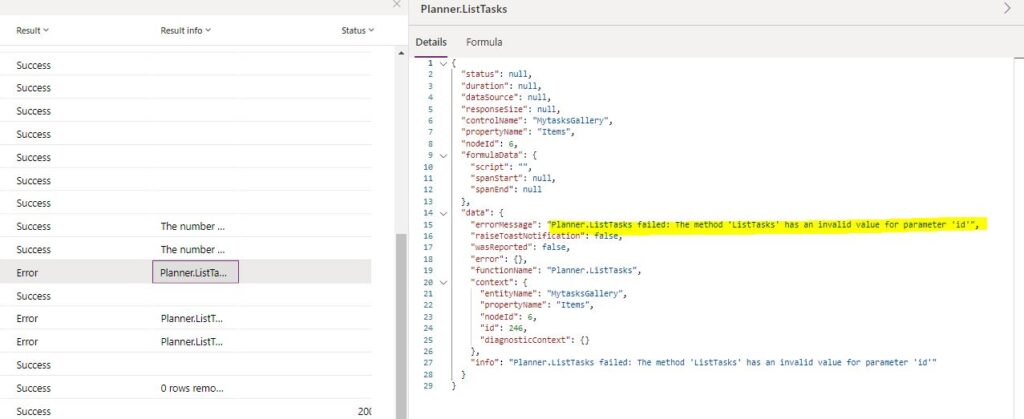
you can enable the Debug Published app feature to add additional debug information in the monitor tool , you will enable it from the app setting ,in the General tap you will find debug Publish app, enable it
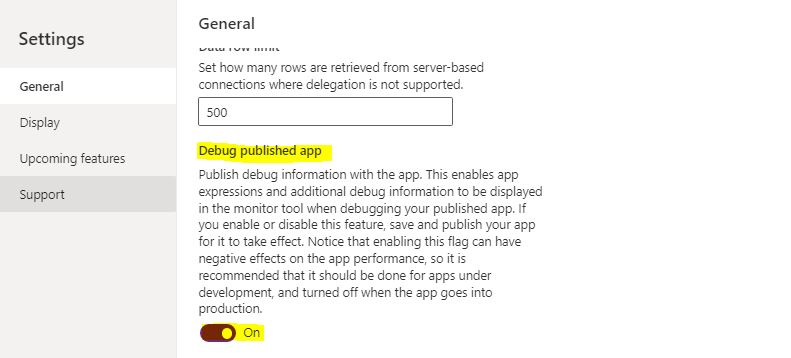
If you want to see the source expressions for the published app in Monitor, you must enable the option to publish the expressions with the app. In traditional development, this setting is equivalent to creating a debug file. It is optional to publish source expressions with your app. Even if this option is disabled, you will be able to see the events that are occurring in your app, but you will be unable to map these events to specific expressions or formulas.
Tips for debugging PowerApps
- Understand the Error Message carefully, When you encounter an error in PowerApps, The error message will provide information about what went wrong, where it happened, and what might have caused the issue. By understanding the error message, you can quickly identify the source of the problem and take steps to fix it.
- In many cases, issues in PowerApps are caused by problems with the data sources. So you have to check that the data sources are correctly configured and that the data is being retrieved correctly.
- Test the app in different browsers, and on different devices to ensure that it works correctly in all scenarios.
- Use App Checker to quickly find the errors on your formula and you can see the details for this error and hints about how to fix , this will help you quickly understand and solve the errors.
Conclusion
In conclusion Debugging is an essential part of any software development process, and the Monitor tool in PowerApps is a powerful tool that provides App makers and administrators with valuable insights into the performance and usage of their applications. By Monitor tool App Makers can identify and resolve issues in their application quikly.
See Also
- Environment Variable In Power Platform With Examples
- How Power Automate Add Working Days To Date?
- How Power Automate Exclude Weekends And Holidays Between Dates?
- How To Format Date In Power Automate?
- Power Automate Add Days To Date
- How To Use PowerApps DateDiff Function?
- PowerApps Parse JSON Example
- How To Use Switch Function In PowerApps?
- PowerApps Lookup Function Examples : Complete Tutorial
Join us
- Subscribe to Power Platform Geeks.
- Register to Saudi Arabia Power Platform User Group.
Need Help
- Have a related question? Please ask it at deBUG.to Community.


