In this post, we will learn How to show Zero values in Power BI Chart?
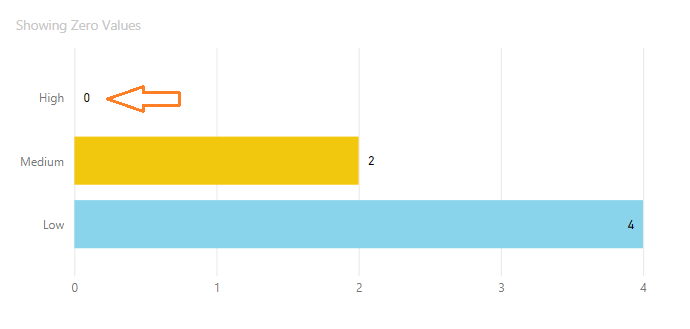
Why Power BI bar chart doesn’t show zero values?
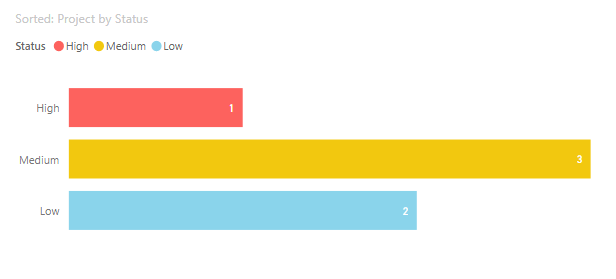
If you try to use a Bar Chart in Power BI to display lookup values like (High, Medium, Low), you will notice that the lookup date labels will be displayed only if they have a corresponding value in the same table, as shown below:
However, if your table does not contain a row with a High value, you will notice that the Power BI bar chart does not display zero values, as shown below:
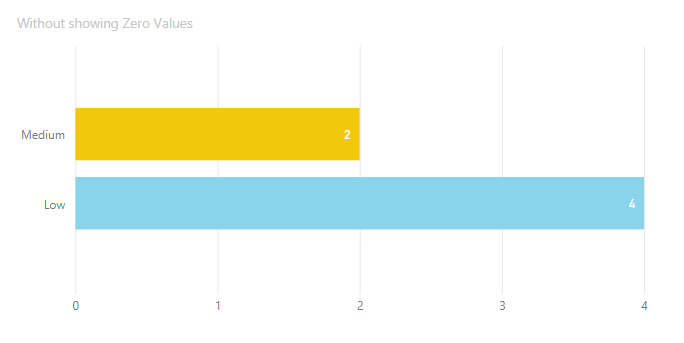
Actually, this is normal behavior; you can only display the stored value in your table; otherwise, the stacked bar chart cannot display any other values if it is zero!
How to show Zero values in Power BI Chart?
To show zero values in Power BI Chart for missing data, you have to do the following:
- Create a Lookup table for your values that you need to show.
- Manage the relationship between the new lookup table and the original table.
- Create a new measure that calculate the count of your values.
- In Stacked Bar Chart, Set the Axis, with the new status field in the lookup table.
Note: in case, you need to perfrom a custom sort order for your stacked bar chart, you have to check this article Power BI Custom Sort order in Bar Chart
1) Create a Lookup Table in Power BI
According to your requirements, you have to create a new lookup table that will contain the corresponding values that you need to display as follows:
- ID (A unique Identifier)
- Attribute (In our example, it will hold the correponding value for each status (High- Medium – Low))
Steps
- At the “Home” tab, click on “Enter Data” to create a new table.

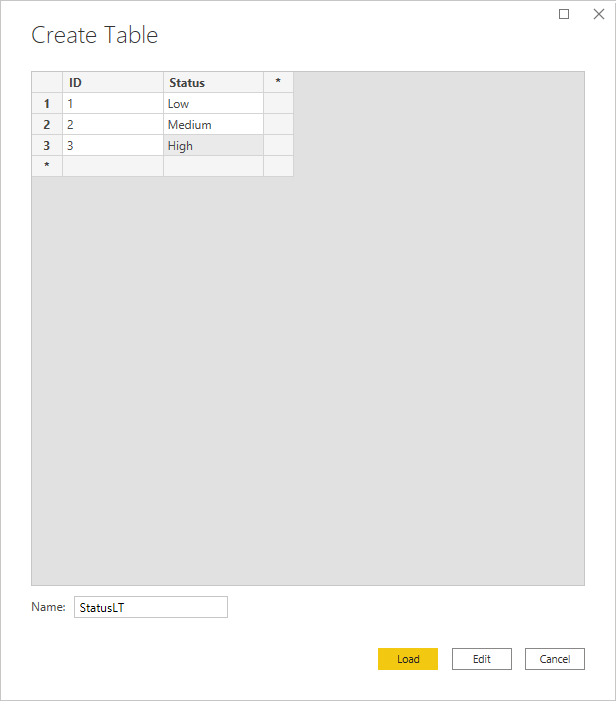
- The “Create Table” should be opened now to add your lookup values.
- Add a column called “ID” to serve as a unique identifier, and another called “Status” (or Attribute, if you want) to carry the corresponding values you’ll need to sort it.
- Finally, set the Table name, and click Load to load the newly created table.
2) Manage Relationships in Power BI
Now, you just need to create a new relationship between the newly created lookup table and the original table as many to one by doing the following:
Steps
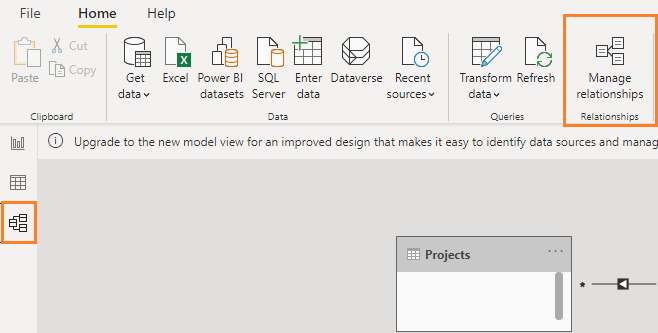
- At the left side, click on “Model” Icon.
- From the above ribbon, click on “Manage Relationships“.
- Click on the “New” button to add a new relationship.
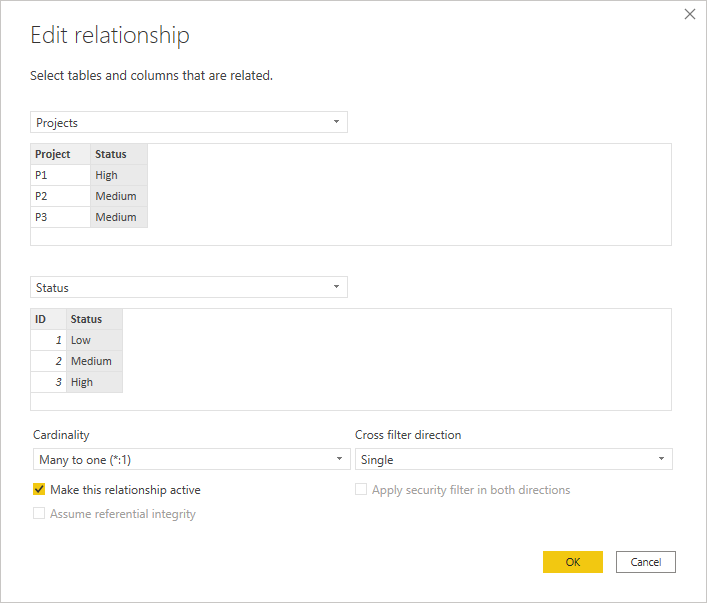
- At the first table, select the original table that holds the column you are need to sort.
- At the second table, select the newly created lookup table.
- Make sure that the columns have been mapped successfuly, and the “Cardinality” is set to “Many to One”, then click “OK“.
3) Create a new measure
Now, you have to create a new measure that calculates the count of your values (In our example, we counts the number of projects)
Steps
- At “Home” tab, click on “New Measure“.
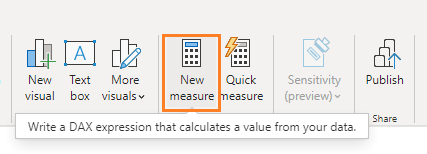
- Add the below formula to claculate the project count
count of project = CALCULATE(COUNT('Projects'[Project])) +04) Set Axis and Value Fields in Stacked Bar Chart
In the last step, you just need to
- Set the Stacked Bar Chart Axis field to the “Status” column that has been created in the new lookup table.
- Set the values to the newly created measure.
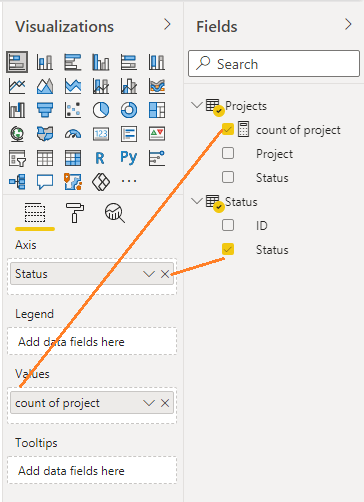
Great, the Stacked Bar Chart now shows zero value in Bar Chart in Power BI for missing data as shown below.

Conclusion
Finally, we learned how to display items with zero values in a Power BI Bar Chart by creating a new lookup table that represents all values even if they are not displayed in the main table.
Download
You can download the PIBX file at Show Zero values in Power BI Chart, and don’t forget to follow Power BI Repo to get more PIBX files samples with complex DAX formulas.
See Also
- Subscribe to Power Platform Geeks
- Power BI Custom Sort order in Bar Chart
- Show items with no data as a Zero in Power BI
- Show items with no data in Power BI
- Have a related question? Please ask it at deBUG.to Community.


